By Iakovos Kalligerakis
This particular experiment had the purpose of analysing the behaviour of certain materials when experiencing deformation due to the application of force and in scenarios where Hooke's Law stood firm. The materials were subjected to forces that deformed them in both elastic manner and plastic manner, and the relations between force applied and amount of deformation were noted, tabulated and displayed in graph form.
Overview
Before I begin reporting on the data, let me run through the basic physical principles that were encountered during the execution of this experiment.
Firstly, Hooke's Law states that the force 'F' needed to extend or compress a spring by some distance 'x' is proportional to that extension[1]. Or:
Firstly, Hooke's Law states that the force 'F' needed to extend or compress a spring by some distance 'x' is proportional to that extension[1]. Or:
F = k * ΔL
where F is the force applied, ΔL is the extension or compression of the spring and k is a constant expressing the spring's stiffness.[2]
However, a generalisation of Hooke's Law can be made so as to include any material with elastic properties, so long as the object's deformation "can be expressed by a single number that can be both positive and negative".[3]
In short, any object will stretch or squash in a way that is proportional to how stiff it is and how much force we apply to it.
Now, before I can begin analysing the results, there are two - amongst others - types of deformation which I should also mention, elastic and plastic deformation. Elastic deformation is "[...]A temporary shape change that is self-reversing after the force is removed, so that the object returns to its original shape"[4], whereas Plastic deformation can be defined as "[...]a permanent deformation or change in shape of a solid body without fracture under the action of a sustained force"[5]. Bearing these things in mind, we can begin tackling the data.
Starting with material "A", measurements of force applied and deformation were noted, and tabulated appropriately.
The 'x' value denotes the amount of force applied in newtons, whereas 'y1' the deformation undergone in millimiteres. Observing the values of the two we notice that they are linear in relation. The values of 'x' scale up to 9.00 newtons in increments of i = 1.00 .
Similarily, the same amount of force 'x', at increments of i, was applied to a material "B", and the results were noted under y2.
y2 was given as (a+0.5)x + c, where the a and c values were calculated by the trendline of y1. The deformation of both was elastic.
 |
| Here we have a cylinder being deformed. Assuming Hooke's Law stands true, then the force applied in both cases b and c is equal in magnitude, but - in this case - opposite in direction. |
 | |
| Example of elastic deformation of an object, where the relationship between stress and strain is linear.[6] |
Data
 |
| Relation between x and y1 |
The 'x' value denotes the amount of force applied in newtons, whereas 'y1' the deformation undergone in millimiteres. Observing the values of the two we notice that they are linear in relation. The values of 'x' scale up to 9.00 newtons in increments of i = 1.00 .
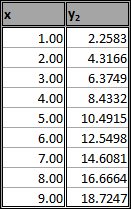 |
| Relation between x and y2 |
y2 was given as (a+0.5)x + c, where the a and c values were calculated by the trendline of y1. The deformation of both was elastic.
The data was then added to charts, and what follows is the visual representation of the relation between force applied and deformation of the two materials.
 |
| Graph A: Extention of y1 |
 |
| Graph B: Series 1 is for material y1 and Series 2 for y2 |
The phenomena that occurs here is the extension of the materials owing to the force and measured on one axis.
As is clearly visible, material 'B' extended more than material 'A' under the same force, meaning that it's k-value was lower.
The next thing to be done is to use the trendline's equation to calculate 'k' for each material. Another way to do this would be to calculate the value of k with the data from each point and then take the average, but through the equation will be quicker.
'k' is given as F over ΔL or (taking a right angle triangle with the trendline as the hypoteneuse) as the tangent of the angle formed at the top right, which would give us :
k = F/ΔL
(for y1)
k = 9 - 1 / (0.015 - 0.003)
k = 8 / 0.012
k = 667 N/m
(for y2)
k = 9-1 / 0.0187247 - 0.0022583
k = 8 / 0.0164664
k = 486 N/m
k = 8 / 0.0164664
k = 486 N/m
The next step was to calculate the region where the two trendlines intersect. This was a simple case of equating the two values, y1 = y2 , which gave us:
2.0583x + 0.2 = 1.5583x + 1.375
2.0583x - 1.5583x = 1.375 - 0.2
x = (1.375 - 0.2) / (2.0583 - 1.5583)
x = 2.35 N
Meaning that the two had the same length of 5.037 mm when a force of 2.35 newtons was being applied.
Overall, Hooke's law seems to stand firm during elastic deformations. However, what happens when we deform a material plastically?
 Here is the relation between force applied and deformation undegone during plastic deformation. As the graph shows, the relation is in no way linear, forming a curve similar to a ploynomial. This also displays that Hookes Law applies only to elastic deformations, as the ratio of change is not constant. If we were to assume that Hooke's Law did, in fact, apply, then we would have that the constant k = F/ΔL would not be constant, as for every change in F, the change in ΔL is not equivalent, which is false.
Now, the experiment, like every experiment, was in no way perfect. Certain errors during it's execution - either due to the accuracy of the equipment or simply the method which was employed - may have caused deviation from any theroretically calculated values. The graphs, tables and all calculations were based entirely on the data extracted from the experiment, so errors in them will be directly linked to any errors during the experiment along with any unlickely computational errors which may have appeared as the machine created the graphs.
Overall, Hooke's law seems to stand firm during elastic deformations. However, what happens when we deform a material plastically?
Here is the relation between force applied and deformation undegone during plastic deformation. As the graph shows, the relation is in no way linear, forming a curve similar to a ploynomial. This also displays that Hookes Law applies only to elastic deformations, as the ratio of change is not constant. If we were to assume that Hooke's Law did, in fact, apply, then we would have that the constant k = F/ΔL would not be constant, as for every change in F, the change in ΔL is not equivalent, which is false. |
| Graph C: Extension of a material undergoing plastic deformation. |
Now, the experiment, like every experiment, was in no way perfect. Certain errors during it's execution - either due to the accuracy of the equipment or simply the method which was employed - may have caused deviation from any theroretically calculated values. The graphs, tables and all calculations were based entirely on the data extracted from the experiment, so errors in them will be directly linked to any errors during the experiment along with any unlickely computational errors which may have appeared as the machine created the graphs.
Conclusion
Through this experiment, the linearity of Hooke's Law was confirmed, as well as how it can only describe elastic deformations. The fact that all objects which exhibit elastic properties are subject to Hooke's Law provides insight to the mechanics of a solid object, but most importantly, it fuels new questions to be answered.
[1],[2]:https://en.wikipedia.org/wiki/Hooke's_law
[3]:https://en.wikipedia.org/wiki/Hooke's_law#General_.22scalar.22_springs
[4]:https://www.nde-ed.org/EducationResources/CommunityCollege/Materials/Structure/deformation.htm
[5]:http://www.merriam-webster.com/dictionary/plastic%20deformation
[6]: Image courtesy of the Kochmann Research Group, Caltech - http://www.kochmann.caltech.edu/research_animations.html
Background image courtesy of Krishnavedala (Own work) [CC0], via Wikimedia Commons - https://commons.wikimedia.org/wiki/File%3ASimple_pendulum_height.svg. This image is under the creative commons 1.0 universal public domain dedication :https://creativecommons.org/publicdomain/zero/1.0/deed.en
No comments:
Post a Comment